
Basic Data Mining with R
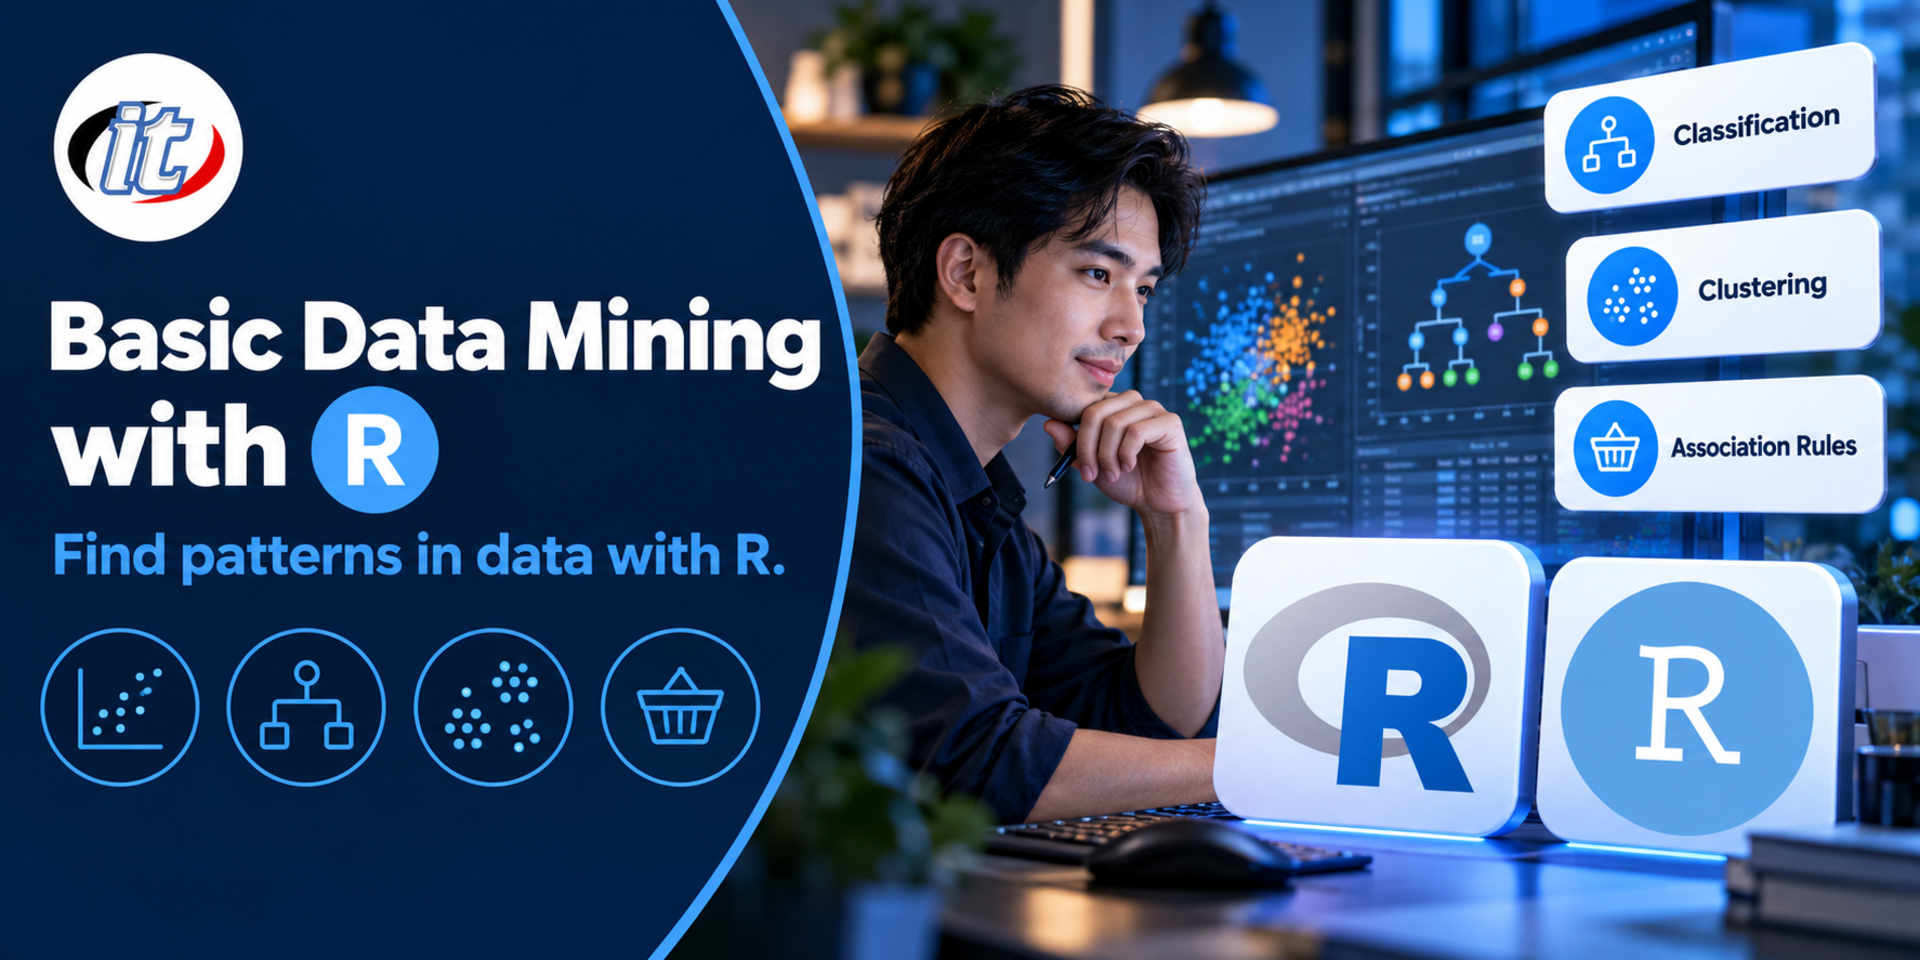
Basic Data Mining with R is a course in data mining with R following the CRISP-DM process, from preparing data and building classification models with tidymodels to evaluating them properly, clustering records and finding association rules. It suits graduate students working on theses, researchers and marketers who already have basic R skills and need to find patterns in their data.
- Duration18 hours · 3 days
- FormatOnsite / live online
- Next roundOn request
- CertificateIncluded
Course overview
The data that organisations and researchers collect, from customer records and sales to surveys and exam results, holds many hidden patterns. Data mining is the work of finding those patterns to make predictions, group similar records or uncover relationships, whether for a thesis, a research project or marketing. R is a free, open source tool widely used in statistics and research, yet beginners often get stuck on preparing data, choosing a technique and evaluating models correctly.
This course builds on basic R and takes learners through data mining with the CRISP-DM process, using R 4.6 and current packages. Learners import, explore and clean data and prepare variables with recipes, then build classification models with tidymodels, including decision trees, k-nearest neighbours, logistic regression, neural networks and random forests, evaluated with cross-validation and tuned. They go on to cluster data with k-means and hierarchical clustering, find association rules with arules and report results with Quarto, before finishing with an end-to-end project workshop. (3 days, 6 hours per day, 18 hours in total, Beginner level.)
What you’ll gain
- Understand data mining principles, the types of task and the steps of the CRISP-DM process
- Import, explore, clean and prepare data for analysis in R
- Build classification models with decision trees, k-nearest neighbours and neural networks through tidymodels
- Evaluate models with confusion matrices, ROC AUC and cross-validation, and choose a suitable model
- Group data with clustering and discover relationships with association rules
- Apply the results in theses, research or marketing, and write reproducible reports with Quarto
Who this course is for
- Master's and doctoral students who use data mining in their theses
- Researchers and lecturers who analyse research data in R
- Marketers and data analysts who segment customers or predict behaviour
- Staff in organisations who look after data and want to go beyond basic R
Prerequisites
- Basic R, such as variables, data frames and using packages, or completion of Basic R Programming
- Basic statistics, such as means, standard deviations and correlation
- Confident computer use and file management
- A laptop that can install R, RStudio or Positron and packages, with permission to install software
Curriculum
Course Details
This course is the 2026 edition of Basic Data Mining with R, rewritten for R 4.6 and for building models with tidymodels, the current approach in R. It runs for 3 days, 6 hours per day (18 hours in total, 09:00-16:00), as lectures with a lab in every topic. Beginner level. Day 1 covers the CRISP-DM process and data preparation, from importing, exploring
and cleaning data to building a recipe. Day 2 builds and evaluates classification models, including decision trees, k-nearest neighbours, logistic regression, neural networks and random forests, with tuning. Day 3 covers clustering, association rules, reporting with Quarto and a project workshop. The course builds on Basic R Programming, so learners should be able to write basic R. They take home datasets, R scripts and a report template.
Day 1 The Data Mining Process and Data Preparation
Section 1: Data Mining and the CRISP-DM Process
- What data mining is, and how it differs from descriptive statistics
- Supervised and unsupervised tasks, and association rule discovery
- The CRISP-DM steps from understanding the problem to deploying the results
- Examples from theses, research and marketing
- Data ethics, privacy and the PDPA
Section 2: Lab: R Refresher and Project Setup
- Review R 4.6 with RStudio or Positron, and creating a project
- Install tidymodels and the course packages, and pin versions with renv
- Review dplyr and the native pipe for data wrangling
- Use set.seed() so analyses can be reproduced
Section 3: Lab: Importing and Exploring Data
- Import data from CSV, Excel and databases through DBI
- Summarise variables and data types
- Explore distributions and relationships with ggplot2
- Find correlations between numeric variables
- Lab: explore customer data and frame the questions to answer
Section 4: Lab: Cleaning Data
- Handle missing values, duplicates and outliers
- Convert data types and manage categorical variables with factors
- Thai text and UTF-8 encoding
- Lab: clean survey data so it is ready for analysis
Section 5: Lab: Preparing Variables with recipes
- Split data into training and test sets with a stratified initial_split
- Scale numbers, create dummy variables and impute missing values in a recipe
- Pool rare categories and drop unhelpful variables
- What data leakage is, and why preparation must be learned from the training set only
- Lab: build a reusable recipe for every model
Day 2 Classification
Section 6: Lab: Decision Trees
- How decision trees work, and splitting with the Gini index
- Build a model with decision_tree() and the rpart engine in a workflow
- Plot and read the tree with rpart.plot, and turn it into explainable rules
- Cost complexity, tree depth and overfitting
- Lab: predict which customers are likely to leave
Section 7: Lab: Evaluating Models
- Confusion matrices, accuracy, precision, recall and F1
- ROC curves and ROC AUC with yardstick
- Cross-validation with vfold_cv and fit_resamples
- Imbalanced data, and why accuracy alone is not enough
- Lab: compare decision tree results on the training and test sets
Section 8: Lab: K-Nearest Neighbours and Logistic Regression
- How k-nearest neighbours works and choosing k
- Why KNN needs scaled data
- Logistic regression as a baseline for comparison
- Read coefficients and odds ratios to explain the result
- Lab: classify customer groups with KNN and logistic regression
Section 9: Lab: Neural Networks and Random Forests
- How a single-hidden-layer neural network works
- Build a model with mlp() and the nnet engine
- Random forests with the ranger engine and the idea of ensembles
- Variable importance
- Lab: compare accuracy with the earlier models
Section 10: Lab: Tuning and Choosing a Model
- Tune hyperparameters with tune_grid()
- Compare several models at once with a workflow set
- Choose the best model and run a final evaluation with last_fit()
- Save the model and predict new data
- Lab: choose the most suitable model for the customer problem
Day 3 Clustering, Association Rules and Reporting
Section 11: Lab: Clustering with k-means
- How clustering works and measuring distance
- Scale data before clustering
- Cluster with kmeans() and k_means() in tidyclust
- Choose the number of clusters with the elbow method and silhouette
- Lab: segment customers by purchasing behaviour
Section 12: Lab: Hierarchical Clustering and Interpreting Clusters
- Hierarchical clustering and reading a dendrogram
- Complete, average and Ward linkage
- Profile each cluster with tables and charts
- Reduce dimensions with PCA to show clusters on a two-dimensional plot
- Lab: name and describe customer segments for marketing planning
Section 13: Lab: Association Rules
- Market basket analysis and transaction data
- Support, confidence and lift
- Find rules with apriori() in arules and filter them by criteria
- Visualise rules with arulesViz
- Lab: find products customers often buy together from basket data
Section 14: Lab: Reporting Results with Quarto
- Structuring a data mining report for a thesis or research project
- Create a Quarto report that combines code, tables, charts and explanation
- Explain model results to non-technical readers
- Use AI assistants carefully to explain code and check results
Section 15: Workshop: An End-to-End Data Mining Project
- Choose a problem and dataset from your own work or research
- Prepare the data, then build and compare models following CRISP-DM
- Summarise the findings in a reproducible Quarto report
- Present the work and get feedback from the instructor
Schedule & training options
For individuals — public rounds
No public rounds are open right now. Join the waiting list and we will contact you first when the next round opens, or ask us on LINE. Or call 02-570-8449 or 088-807-9770
For organisations — in-house / private
- Tailor the content to your team’s tools and projects
- Your dates, at your office or live online
- Quotation with tax ID for procurement
Instructors

Frequently asked questions
What is data mining, and what are the main techniques?
Data mining is the search for hidden patterns or knowledge in large amounts of data to support decisions or predictions. The main techniques fall into three groups: classification, such as decision trees, k-nearest neighbours, neural networks and random forests; clustering, which groups similar records, such as k-means; and association rules, such as products customers often buy together. The work follows a process such as CRISP-DM, from understanding the problem to putting the results to use.
How do classification and clustering differ?
Classification is supervised learning. It needs data where the answer is already known, such as whether customers have left, to build a model that predicts the class of new records, and its accuracy can be measured on a test set. Clustering is unsupervised. No answers are given in advance, and the method groups similar records itself, for example segmenting customers by purchasing behaviour with k-means, after which the analyst interprets what each group is like.
How do you prepare data before data mining?
Collect the data from files or databases and check its quality. Handle missing values, duplicates and outliers, and fix data types. Split the data into training and test sets first, then scale numbers, create dummy variables or impute missing values using the training set only, to prevent data leakage. The course uses recipes from tidymodels to bundle these steps so they can be reused with every model.
Who is the Basic Data Mining with R course for, and what should I know beforehand?
It suits master's and doctoral students using data mining in their theses, researchers and lecturers, marketers and data analysts, and staff who look after organisational data. You should be able to write basic R, such as using variables, data frames and packages, or have completed Basic R Programming, and know basic statistics such as means and standard deviations.
What will I be able to do after the Basic Data Mining with R course?
You will be able to prepare data and plan the work with CRISP-DM, build classification models with tidymodels, evaluate them with confusion matrices, ROC AUC and cross-validation and choose a suitable model, segment customers with k-means and hierarchical clustering, find products bought together with association rules, and write reproducible Quarto reports for theses, research or marketing. Participants who complete the training receive a Certificate of Completion with its own number, which can be verified online.
Can the Basic Data Mining with R course be run in-house for our team?
Yes. It can be run in-house for your team, with examples adapted to your own work, such as using your organisation's anonymised data as the exercise for classification or customer segmentation. You can request a quotation from this page, or contact us on LINE @itgenius or by phone on 02-570-8449.