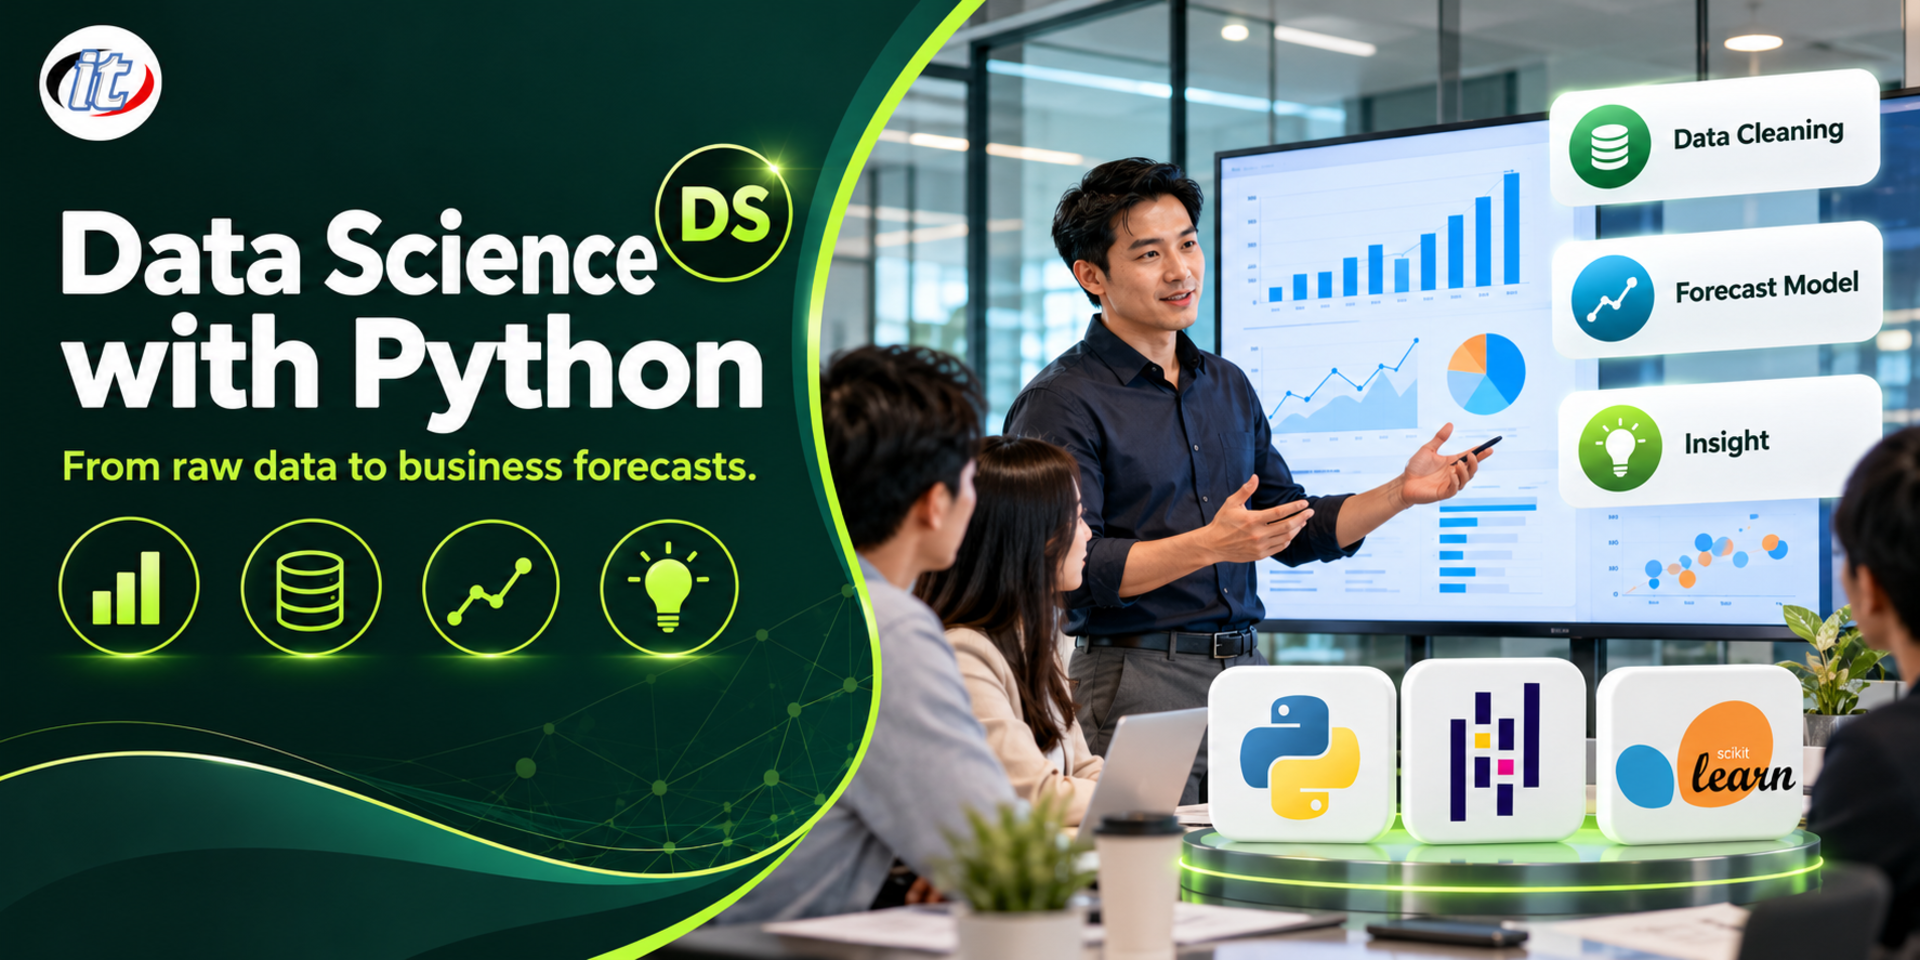
Data Science with Python is a hands-on course in predictive analytics with Python, following CRISP-DM from cleaning and exploring data with pandas to building and evaluating regression, clustering, decision tree and association rule models with scikit-learn. It suits data analysts, programmers and anyone who has already completed an introductory Python course.
Most organisations hold large amounts of sales, customer and system usage data, yet often use it only for backward-looking reports. The same data can drive predictive models, for example forecasting sales, predicting which customers are likely to cancel, segmenting customers or finding products that are often bought together. Python has a complete toolkit for this work and has become the standard language of data science.
This course takes learners through predictive analytics following the CRISP-DM process: framing the business question, preparing and cleaning data with pandas 3, exploring it with charts and statistics, building features and pipelines with scikit-learn, then modelling with linear and logistic regression, K-Means clustering, decision trees and ensembles, association rules and an introduction to neural networks, all evaluated properly. It closes with presenting results and a forecasting project on real data. (3 days, 6 hours per day, 18 hours in total, Intermediate level.)
What you’ll gain
Frame data science problems and plan the work with the CRISP-DM process
Prepare, clean and transform data correctly with pandas 3
Explore data with charts and statistics to find relationships before modelling
Build features and pipelines with scikit-learn without data leakage
Build and evaluate regression and classification models with suitable metrics
Segment data with K-Means and discover association rules
Apply decision trees, random forests, gradient boosting and basic neural networks
Communicate analysis results and save models for later use
Who this course is for
Data analysts and report writers who want to move from historical reports to forecasting
Programmers and IT staff who want to start data science work with Python
Marketing, sales and planning teams who rely on data to make decisions
Lecturers and students looking for a structured approach to predictive analytics projects
Anyone who has completed an introductory Python course and wants to move into data work
Prerequisites
Basic Python such as variables, lists, dictionaries, loops and functions
Basic statistics such as mean and standard deviation (reviewed during the course)
Confidence managing files and folders on a computer
A laptop on which you can install software, or a Google account to use Google Colab
Curriculum
Course Details
This is the 2026 edition that replaces the previous content of Data Science with Python. It keeps the original core of CRISP-DM, data cleaning, regression, clustering, decision trees, association rules and neural networks, but moves the tooling to uv, JupyterLab, pandas 3 and scikit-learn 1.9, and adds feature engineering, pipelines, cross-validation, gradient boosting and presenting results. It runs for 3 days, 6 hours per day (18 hours in total, 09:00-16:00), as lectures with a lab in every topic. Intermediate level. An ordinary laptop without a GPU is enough and every tool is open source. The course focuses on business forecasting; learners who want to go deeper into machine learning algorithms can continue with Python for Machine Learning.
Day 1Preparing and Understanding Data
Section 1: Lab: Predictive Modelling and CRISP-DM
How descriptive, predictive and prescriptive analytics differ
The six CRISP-DM phases from business understanding to deployment
Turn business questions into regression, classification or clustering problems
Set up a project with uv and work in JupyterLab, VS Code or Google Colab
Lab: frame a forecasting problem for a sample store with CRISP-DM
Section 2: Lab: Working with Data in pandas 3
DataFrames, Series and reading data from CSV, Excel and databases
Select, filter, sort and create columns with loc and assign
Copy-on-Write and the default str data type in pandas 3
groupby, pivot_table and merge for summarising and combining data
Lab: summarise monthly sales by branch and product category
Section 3: Lab: Data Cleaning
Check data quality: missing values, duplicates, wrong types and anomalies
Choose how to handle missing values: drop, impute or add an indicator
Convert dates, text and categories into usable form
Detect and handle outliers with IQR and z-scores
Lab: clean a real customer dataset with several problems
Section 4: Lab: Exploratory Data Analysis
Histograms, box plots and scatter plots with Matplotlib and seaborn
Look at distributions, skew and relationships between variables
Correlation matrices and the difference between correlation and causation
Explore data by segment to find signals worth predicting from
Lab: EDA of customer churn data with a summary of findings
Section 5: Statistics for Predictive Modelling
Populations, samples and random train/test splits
The normal distribution, central tendency and measures of spread
Hypothesis testing and p-values for data practitioners
Bias, variance, overfitting and underfitting
Lab: compare sales between two groups with sound statistics
Day 2Regression, Classification and Clustering
Section 6: Lab: Feature Engineering and Pipelines
Encode categorical data with OneHotEncoder and OrdinalEncoder
Scale data with StandardScaler and MinMaxScaler
Build features from dates, running totals and customer behaviour
Combine the steps with Pipeline and ColumnTransformer
What data leakage is and how to prevent it
Section 7: Lab: Linear Regression
The idea behind linear regression and how to interpret coefficients
Multiple regression and the multicollinearity problem
Evaluate with MAE, RMSE and R²
Regularisation with Ridge and Lasso
Lab: forecast weekly sales from promotions and seasonality
Section 8: Lab: Logistic Regression and Evaluation
Logistic regression and class probabilities
Confusion matrix, precision, recall and F1-score
ROC curves, AUC and choosing a threshold based on business cost
Handling imbalanced data with class_weight
Lab: predict which customers are likely to cancel
Section 9: Cross-Validation and Hyperparameter Tuning
Why a single train/test split is not enough
K-Fold, Stratified K-Fold and TimeSeriesSplit
Search hyperparameters with GridSearchCV and RandomizedSearchCV
Compare several models fairly
Lab: choose the best model for the churn problem
Section 10: Lab: Data Clustering
Unsupervised learning and distance measures
K-Means, the elbow method and silhouette score
Hierarchical clustering and dendrograms
Build RFM features for customer segmentation
Lab: segment customers and name each segment for marketing
Day 3Trees, Association Rules and Putting Models to Use
Section 11: Lab: Decision Trees and Ensembles
How a decision tree builds decision rules
Control tree depth and prevent overfitting
Random forests and HistGradientBoosting
Feature importance and permutation importance
Lab: explain the drivers of customer churn with a tree diagram
Section 12: Lab: Association Rules Discovery
Market basket analysis and preparing basket data
Support, confidence and lift
Find frequent itemsets with Apriori and FP-Growth in mlxtend
Keep rules that make business sense and drop the useless ones
Lab: find products worth promoting together from purchase data
Section 13: Introduction to Neural Networks
Neurons, layers, activation functions and learning by backpropagation
Build neural networks with MLPClassifier and MLPRegressor
When a neural network is worth it and when classic models do better
Lab: compare a neural network with the models built earlier
Section 14: Lab: Communicating Results and Using Models
Tell the story of an analysis with charts executives can read
Save models safely with skops and load them again
Score new data with a model and export the results to a file
Use AI assistants to help write pandas code, and check the result before using it
Monitor accuracy as the data changes over time (data drift)
Section 15: Workshop: Capstone Project
Choose a forecasting problem from the prepared datasets or your own data
Work through the full CRISP-DM cycle from data preparation to evaluation
Present results, limitations and recommendations for the business
Review the work together and plan next steps
Schedule & training options
For individuals — public rounds
No public rounds are open right now. Join the waiting list and we will contact you first when the next round opens, or ask us on LINE. Or call 02-570-8449 or 088-807-9770
CRISP-DM has six phases: business understanding, data understanding, data preparation, modelling, evaluation to check that the model really answers the business question, and deployment to put the results to use. The phases loop back as new findings emerge. On the course this framework is used in every lab and in the capstone project.
What is the difference between linear regression and logistic regression?
Linear regression predicts a continuous number, such as weekly sales, and is evaluated with MAE or RMSE. Logistic regression classifies, for example whether a customer will cancel, by producing a probability that is turned into a decision with a threshold, and is evaluated with precision, recall and AUC. On the course you try both on sales and customer data.
How do you clean data with pandas?
Start by checking data quality with info, describe and isna to see missing values, data types and anomalies. Then remove or merge duplicate rows, fix types such as dates and categories, decide how to handle missing values, and find outliers with IQR or z-scores. In pandas 3 chained assignment no longer works, so changes should be made directly with loc or assign.
Who is the Data Science with Python course for, and what should I know beforehand?
It suits data analysts, programmers, IT staff, marketing and planning teams, and lecturers and students who want to build predictive models. You need basic Python skills such as variables, lists, loops and functions, or to have completed an introductory Python course. The statistics you need are reviewed during the course.
What will I be able to do after the Data Science with Python course?
You will be able to frame problems with CRISP-DM, prepare and clean data with pandas, explore it with charts, build pipelines and regression, classification, K-Means, decision tree and random forest models, discover product association rules, evaluate with cross-validation, and present results and save models for reuse. Participants who complete the training receive a Certificate of Completion.
Can the Data Science with Python course be run in-house for our team?
Yes. IT Genius Institute runs in-house training and can adapt the lab examples to your organisation's data and problems, such as sales, customer or production data. Please prepare data with personal information removed. Contact us for a quotation and to discuss the content.
Python is one of the most widely used programming languages today, in web development, automation, data work, IoT and AI. Its readable syntax and gentle learning curve make it the first language of choice for many schools and organisations. Yet many beginners…
Django is a long-established Python web framework for building database-driven web sites and business systems, because it comes with everything you need, from the ORM, admin site, forms and user system to protection against common vulnerabilities. Teams can…
Today's web sites, mobile apps and partner services all talk to each other through REST APIs, so teams that already use Django need to expose their data as APIs that are well designed, secure, documented and testable. The Django REST Framework is the standard…