DevOps · DOP-07

AIOps and AI for IT Service Management

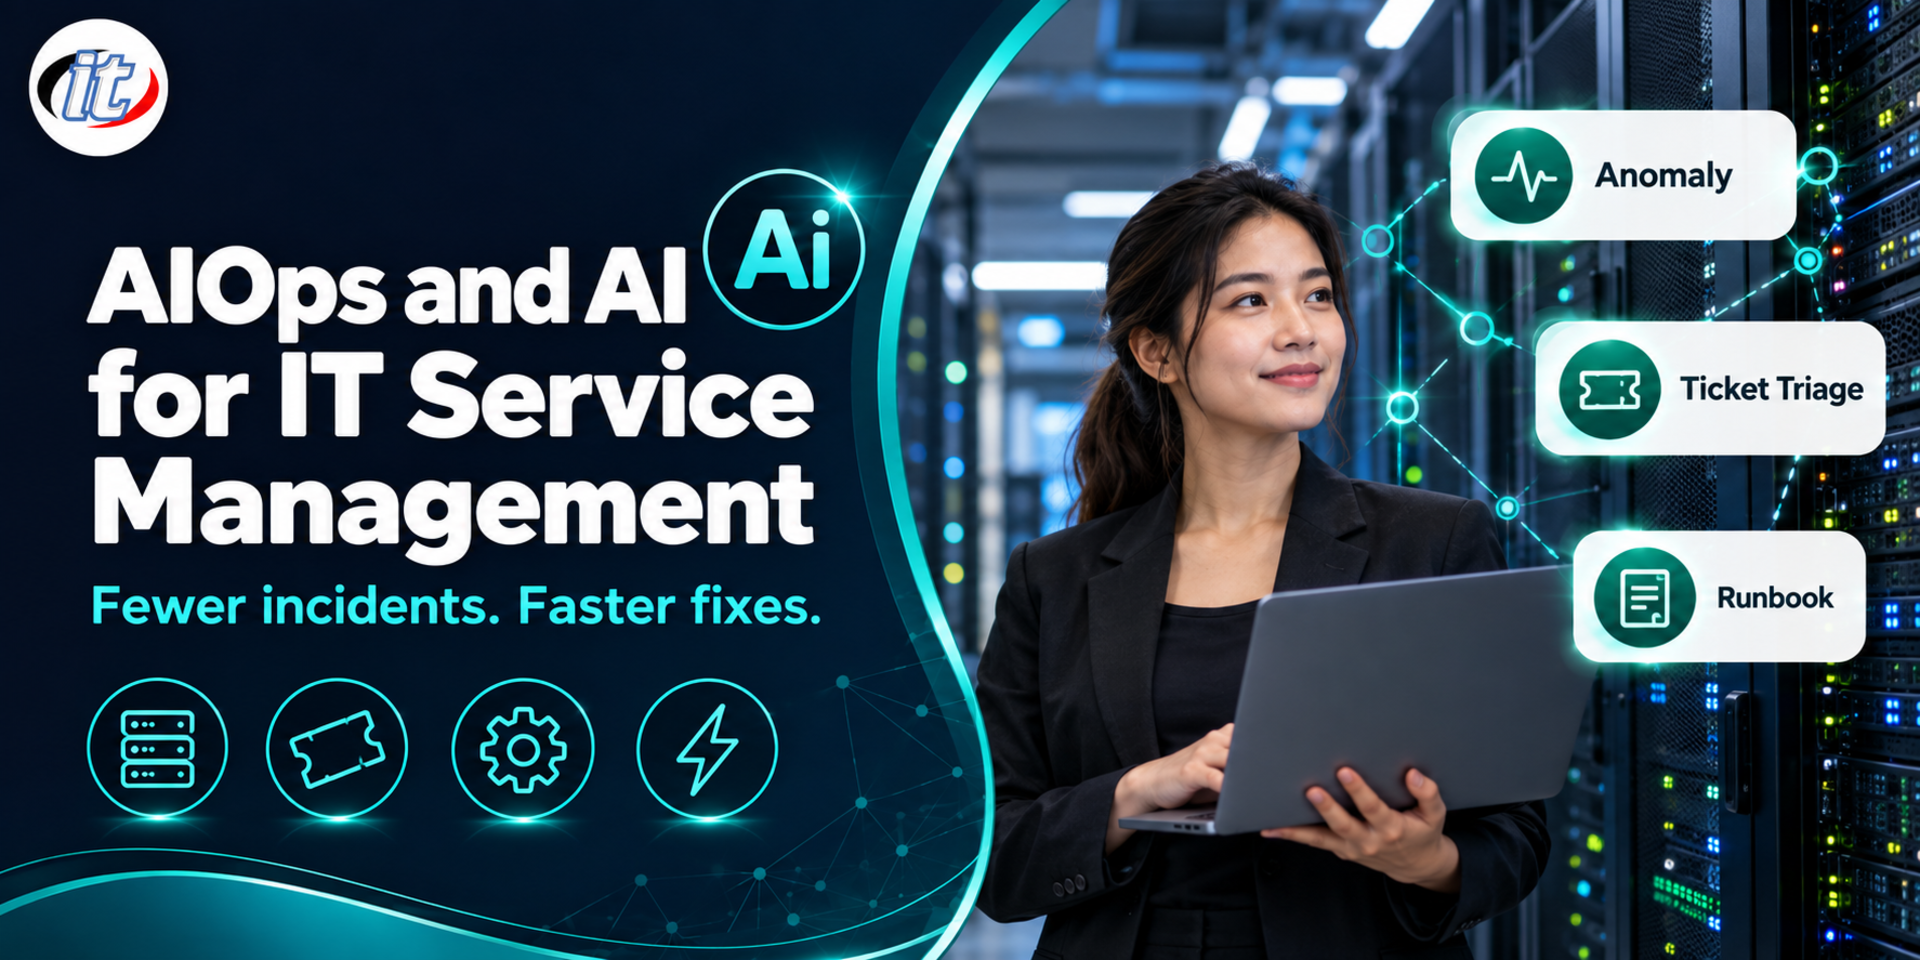
AIOps and AI for IT Service Management is a course in applying AI to Prometheus and Grafana data, from anomaly detection, alert correlation and root cause analysis to ticket classification and runbook agents with an approval step. It suits IT operations, SRE and service desk teams who want fewer noisy alerts and faster, more consistent incident handling.

Updated
From 7,110 THB / person 7,900 −10% excl. VAT 7% · group rates available
PDFDownload the course outline
  • Duration12 hours · 2 days
  • FormatOnsite / live online
  • Next roundOn request
  • CertificateIncluded

Course overview

As systems grow to many services, IT operations and service desk teams run into the same problems. One fault sets off dozens of alerts at once, tickets arrive without the right category, the same issue gets solved again because nobody can find the last fix, and the runbook goes unread at two in the morning. AIOps and AI for IT service management can ease this load, provided the AI works on the organisation's real data and people approve the steps that matter.

This course builds on Observability with Prometheus and Grafana. It does not repeat installation or dashboard basics, and instead puts metric, log and ticket data to work with AI in a structured way. Learners detect metric anomalies, cut duplicate alerts and group them into a single incident, analyse logs and build a root cause assistant that cites its evidence. They then use LLMs to classify and route tickets, find similar tickets with answers from the knowledge base, and turn runbooks into a runbook agent in n8n that must ask for approval before changing a system. The course closes with a capstone that runs from the first alert to a closed ticket. (2 days, 6 hours per day, 12 hours in total, Intermediate level.)

What you’ll gain

  • Explain AIOps and choose statistics, machine learning or an LLM to suit each task
  • Detect anomalies in Prometheus metrics more accurately than fixed thresholds
  • Reduce duplicate alerts and group related alerts into a single incident
  • Use AI to analyse logs and support root cause analysis with evidence
  • Classify, prioritise and route tickets automatically, with measured accuracy
  • Build a system that finds duplicate tickets and suggests fixes from the knowledge base
  • Turn runbooks into a runbook agent with an approval step and an audit trail
  • Measure and govern the use of AI in IT operations safely

Who this course is for

  • IT operations, SRE and DevOps teams who run systems with Prometheus and Grafana
  • Service desk and ITSM teams who want to handle tickets faster and more accurately
  • Platform engineers who want to reduce alert fatigue and repetitive fixes
  • IT team leads who need to set the direction for using AI in operations
  • Graduates of Observability with Prometheus and Grafana, or people with similar experience

Prerequisites

  • Working knowledge of Prometheus, Alertmanager and Grafana, or completion of Observability with Prometheus and Grafana
  • Basic Python, Docker and Linux command-line skills
  • A basic understanding of incident, request and change processes in IT service management
  • A laptop with at least 16 GB of RAM that can run Docker Desktop, with permission to install software

Curriculum

Course Details

A 2-day course, 6 hours per day (12 hours in total, 09:00-16:00), alternating lectures with labs on a single simulated microservice system throughout. Intermediate level. The course builds on Observability with Prometheus and Grafana and does not repeat installation or basic PromQL and dashboards. Instead it puts metric, log and ticket data to work with AI, from anomaly detection, alert correlation and root cause

analysis to ticket handling and a runbook agent that must ask for approval before changing a system. Every lab runs on the learner's own machine with Docker. Learners use a local LLM through Ollama, or their own or company API key, with API usage billed by actual use. Learners take home a lab guide, docker-compose files for the simulated system, Python scripts, n8n workflow files and runbook templates.

Day 1 AIOps: From Metrics and Logs to Incidents

Section 1: AIOps and AI for ITSM: An Overview

  • What AIOps covers: noise reduction, correlation, anomaly detection and root cause support
  • Which tasks suit statistics, which suit machine learning and which suit an LLM
  • ITSM processes AI can help with: incident, request, problem and change
  • The risk of letting AI change systems on its own, and the principle of human approval

Section 2: Lab: Setting Up the Simulated AIOps Environment

  • Deploy a simulated microservice app with Prometheus, Alertmanager, Grafana and Loki using Docker Compose
  • Install self-hosted n8n and connect it to an LLM through Ollama or an API
  • Install an open source ticketing system and import a sample ticket set
  • Lab: run the first fault injection script and count how many alerts fire at once

Section 3: Lab: Metric Anomaly Detection

  • The limits of fixed thresholds for systems with daily and weekly cycles
  • Build baselines with recording rules and PromQL functions such as predict_linear
  • Detect anomalies in Python with statistics and machine learning, and send results back as alerts
  • Lab: catch abnormal resource use before it reaches the old threshold

Section 4: Lab: Alert Deduplication and Incident Correlation

  • Get the most out of Alertmanager grouping, inhibition and silences
  • Group alerts by time window, labels and service relationships
  • Send alert groups to an LLM to summarise them as one incident with its impact
  • Lab: turn dozens of alerts from a simulated fault into a single incident

Section 5: Lab: AI-Assisted Log Analysis

  • Query logs related to an incident with Loki's LogQL
  • Cluster log messages into templates to spot messages never seen before
  • Have an LLM summarise frequent errors and where things started to go wrong
  • Lab: find the new log messages that appeared after a bad deployment

Section 6: Lab: A Root Cause Assistant

  • Gather context: metrics, logs, deployments and recent changes
  • Have an LLM propose root cause hypotheses with evidence and a confidence level
  • Test hypotheses against real data and watch for plausible answers with no evidence
  • An overview of AI features in Grafana and connecting agents to Grafana through MCP
  • Lab: build an assistant that proposes the cause of the simulated fault with links to evidence
Day 2 AI for ITSM and Runbook Agents

Section 7: Lab: Automatic Ticket Classification and Routing

  • Design the categories, priorities and resolver groups the AI must choose from
  • Compare few-shot LLM classification with an embedding-based classifier
  • Measure with a confusion matrix and send low-confidence tickets to a person
  • Lab: classify the sample ticket set and measure accuracy before going live

Section 8: Lab: Duplicate Tickets and the Knowledge Base

  • Find similar tickets with vector search to merge duplicates of the same problem
  • Suggest fixes from past tickets and knowledge base articles, citing the source
  • Draft new KB articles from closed tickets for staff to review before publishing
  • Lab: a service desk assistant that proposes KB answers for staff to confirm

Section 9: Lab: From Runbook to Runbook Agent

  • Rewrite runbooks as structured steps with conditions, commands and expected results
  • Build an agent in n8n that calls tools through MCP, starting with read-only permissions
  • Let the agent pick a runbook by incident type and report each step
  • Lab: an agent that diagnoses a slow database by runbook and writes the findings to the ticket

Section 10: Lab: Safe Auto-Remediation

  • Choose tasks suited to automatic fixes, with command allowlists, dry runs and a rollback plan
  • Ask for human approval in chat before changing a system, linked to the change process
  • Keep an audit log of every decision and every command
  • Lab: fix a memory leak with a restart that needs approval first

Section 11: Measuring and Governing AIOps

  • Metrics: MTTA, MTTR, alerts per incident and classification accuracy
  • Track LLM costs and match the model to the task
  • Data policy and PDPA when tickets and logs contain personal data
  • Workshop: an AIOps results dashboard in Grafana

Section 12: Workshop: Capstone from Alert to Closed Ticket

  • Receive a complex simulated fault from the instructor
  • Detect it, correlate alerts into an incident and open a ticket automatically
  • Find the cause with the AI assistant and fix it with the runbook agent and approval step
  • Close the ticket with a draft KB article and a post-incident report

Schedule & training options

For individuals — public rounds

No public rounds are open right now. Join the waiting list and we will contact you first when the next round opens, or ask us on LINE. Or call 02-570-8449 or 088-807-9770

For organisations — in-house / private

  • Tailor the content to your team’s tools and projects
  • Your dates, at your office or live online
  • Quotation with tax ID for procurement
Corporate training quote

Instructors

Frequently asked questions

Who is AIOps and AI for IT Service Management for, and what background is needed?

Built for IT operations, SRE and DevOps teams who run systems with Prometheus and Grafana · Service desk and ITSM teams who want to handle tickets faster and more accurately · Platform engineers who want to reduce alert fatigue and repetitive fixes Background you should have: Working knowledge of Prometheus, Alertmanager and Grafana, or completion of Observability with Prometheus and Grafana · Basic Python, Docker and Linux command-line skills Not sure the fit is right? Talk to our team on LINE @itgenius or call 02-570-8449.

How much does AIOps and AI for IT Service Management cost and how long does it run?

THB 7,900 (currently THB 7,110 on promotion). The course runs 12 hours. The price excludes 7% VAT (for payment in a company's name). Pay by bank transfer to the company account, confirm it on our payment page, and we can issue the receipt or tax invoice in your company's name.

Do I get a certificate?

Yes. Everyone who completes the course receives a Certificate of Completion from IT Genius Institute. Each certificate carries its own number, and anyone holding that number can verify it online on our certificate page, so you can add it to your portfolio or pass it to HR as evidence of training.

Where does the training take place, and is there an online option?

You can attend onsite at IT Genius Institute or arrange to join online, and we also run it as a private in-house session for your team. Ask about dates and venues on LINE @itgenius or call 02-570-8449.

What if I fall behind or miss a session — can I retake it?

Yes. You may retake the same course free of charge in a later round, under the institute's conditions. Tell our team which course and round you attended, and we will check it and offer you the rounds that still have seats. Ask us on LINE @itgenius or call 02-570-8449.

How do I enrol, or request a quotation for my company?

Enrol online with the registration form on this page. You can register several attendees at once and enter your tax ID and billing address for the tax invoice. Or request a company quotation straight from the quote button. For anything else call 02-570-8449 or reach us on LINE @itgenius.