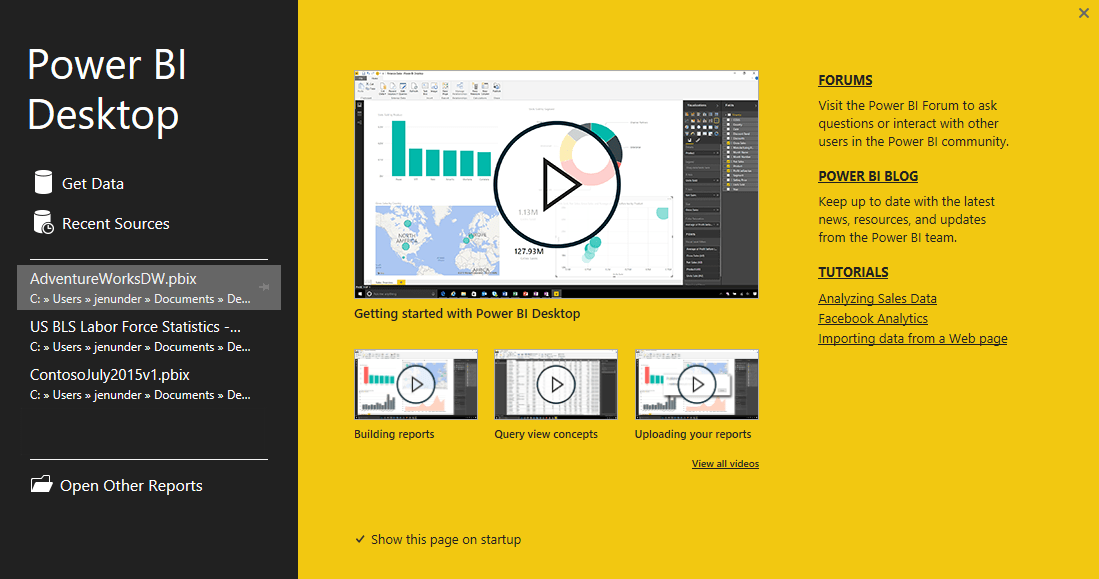
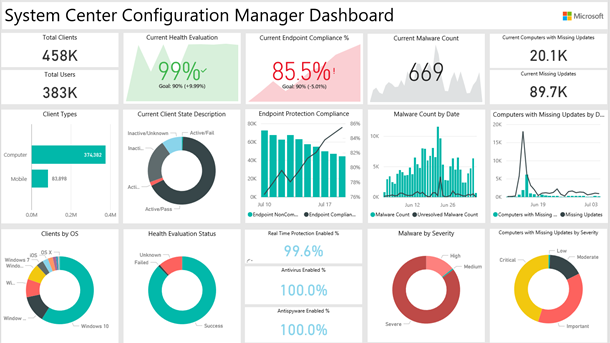
Analyzing Data with Power BI Desktop is a 18-hour training course by IT Genius Institute. Microsoft Power BI Desktop เป็นเครื่องมือที่ใช้ในการวิเคราะห์ข้อมูลขนาดใหญ่ ใช้วิเคราะห์ข้อมูลเชิงลึก รายงานผลแบบ Interactive…
Training schedule
No public rounds are open right now — register your interest and we will contact you when the next round opens, or request an in-house session for your team.
Microsoft Power BI Desktop เป็นเครื่องมือที่ใช้ในการวิเคราะห์ข้อมูลขนาดใหญ่ ใช้วิเคราะห์ข้อมูลเชิงลึก รายงานผลแบบ Interactive ซึ่งเป็นโปรแกรมชั้นนำด้านการสืบค้นข้อมูลและสร้างแบบจำลองในวงการอุตสาหกรรม สามารถสร้างและเผยแพร่รายงานไปที่ Power BI ได้ ซึ่งเป็นการเพิ่มขีดความสามารถในการวิเคราะห์ข้อมูลภายในเวลาที่ต้องการให้ได้ผลลัพธ์ทุกที่ทุกเวลา
Objectives
เพื่อให้รู้จัก Microsoft Power BI ตั้งแต่เริ่มต้น
รู้จักแหล่งข้อมูลสำหรับ Power BI Desktop
เข้าใจการจัดรูแปบบข้อมูลด้วย Power BI Desktop
เรียนรู้และเข้าใจการสร้าง Dashboard ด้วย Power BI Desktop
สามารถใช้งาน Power BI Service ได้
Who this course is for
บุคคลทั่วไป
นักเรียนนักศึกษา
ครู คณาจารย์
เจ้าหน้าที่และผู้ดูแลที่เกี่ยวข้อง
Prerequisites
การใช้งานคอมพิวเตอร์พื้นฐาน
การใช้งานฐานข้อมูลพื้นฐาน
รู้จักภาษา SQL มาบ้าง
ทักษะการใช้งานอินเตอร์เน็ตและการค้นหาข้อมูล
Curriculum
Module 1 รู้จักกับ Microsoft Power BI
การติดตั้ง Power BI Desktop
ความต้องการเบื้องต้นของระบบ
การดาวน์โหลด และติดตั้ง Power BI Desktop
การใช้งาน Power BI Desktop
แนะนำ Power BI Community
Module 2 แหล่งข้อมูลสำหรับ Power BI Desktop
การใช้ Excel เป็นแหล่งข้อมูล
การเชื่อมต่อไปยังฐานข้อมูล Database
การเชื่อมต่อไปยัง SQL Azure
การเชื่อมต่อไปยัง Files ใน Folder
การสร้างตารางข้อมูลขึ้นใหม่เอง
การเชื่อมต่อไปยัง SSAS
Module 3 การแปลงข้อมูลด้วย Power BI Desktop (Data Transformation)
เรียนรู้ DAX Function ที่มักใช้งานบ่อย
SUM และ SUMX
COUNT, COUNTX, DISTINCTCOUNT และ COUNTROWS
CALCULATE
FILTER, ALL และ ALLSELECTED
RANK และ TOPN
EARLIER, MAX และ MIN
SUMMARIZE
RELATED และ RELATEDTABLE
ISFILTERED และ CROSSFILTER
CONTAINS
HASONRVALUE และ SELECTEDVALUE
รู้จักการทำ Aggregating and Comparing over Time
รู้จักการหา Year-to-Date, Quarter-to-Date และ Month-to-Date ด้วยTime Intelligence Function แบบต่าง ๆ
การหาค่า Aggregate ในกรณีที่เป็นปีงบประมาณหรือ Fiscal Year
การหาค่าจาก Previous Period ต่าง ๆ เช่นต้องการหาค่ายอดขายของเดือนที่แล้ว
Module 5 การสร้าง Dashboard ด้วย Power BI Desktop Visualization
ตัวนำเสนอข้อมูล (Visualization)
แผนภูมิวงกลม และแผนภูมิ Treemap
กราฟแท่งผสมกราฟเส้น (Combo Chart)
เส้นแนวโน้ม (Trend line)
ตัวแบ่งส่วนข้อมูล (Slicer)
การเข้าสู่ Focus Mode และเรียกดูข้อมูล
แผนที่ (Map)
ตารางและเมทริกซ์ (Table & Matrix)
แผนภูมิกระจาย (Scatter Chart)
แผนภูมิน้ำตก (Waterfall Chart)
เกจ, การ์ด และ KPI
การควบคุมสีสัน, เส้นอ้างอิง และเส้นขอบ
รูปทรง, กล่องข้อความ และรูปภาพ
การทำงานร่วมกันของหลายตัวนำเสนอ
จัดเค้าโครงหน้า (Layout)
ความสัมพันธ์ของตัวนำเสนอ
การสร้างหน้าซ้ำ
แสดงกลุ่มข้อมูลที่ไม่มีข้อมูล
การปรับแต่งการแสดงผลรวม
การวางตำแหน่งตัวนำเสนอ
การแสดง Hierarchy ของวันเวลา
การผนวก R – Visual
Module 6 การใช้งาน Power BI Service
การอัพโหลดขึ้น Power BI Service
การตั้งค่าและจัดการ Dashboard
รู้จักกับ Power BI Gateway ที่จะช่วยในการ Update ข้อมูลอัตโนมัติ
การใช้งาน Natural Language Queries
การแชร์และการส่งออก Dashboard
การเผยแพร่ไปยังเว็บ (Publish)
ดู Power BI Dashboard บนอุปกรณ์เคลื่อนที่
การสร้างและใช้งาน Content Pack
การผนวกรวมกับ OneDrive for Business
การจัดการความปลอดภัยระดับแถวข้อมูล
Frequently asked questions
Who is Analyzing Data with Power BI Desktop for, and what background is needed?
Built for บุคคลทั่วไป · นักเรียนนักศึกษา · ครู คณาจารย์ Background you should have: การใช้งานคอมพิวเตอร์พื้นฐาน · การใช้งานฐานข้อมูลพื้นฐาน Not sure the fit is right? Talk to our team on LINE @itgenius or call 02-570-8449.
How much does Analyzing Data with Power BI Desktop cost and how long does it run?
THB 7,500. The course runs 18 hours. The fee covers course materials, lunch and refreshments throughout. Pay by bank transfer to the company account, confirm it on our payment page, and we can issue the receipt or tax invoice in your company's name.
Do I get a certificate?
Yes. Everyone who completes the course receives a Certificate of Completion from IT Genius Institute. Each certificate carries its own number, and anyone holding that number can verify it online on our certificate page, so you can add it to your portfolio or pass it to HR as evidence of training.
Where does the training take place, and is there an online option?
You can attend onsite at IT Genius Institute or arrange to join online, and we also run it as a private in-house session for your team. Ask about dates and venues on LINE @itgenius or call 02-570-8449.
What if I fall behind or miss a session — can I retake it?
Yes. You may retake the same course free of charge in a later round, under the institute's conditions. Tell our team which course and round you attended, and we will check it and offer you the rounds that still have seats. Ask us on LINE @itgenius or call 02-570-8449.
How do I enrol, or request a quotation for my company?
Enrol online with the registration form on this page. You can register several attendees at once and enter your tax ID and billing address for the tax invoice. Or request a company quotation straight from the quote button. For anything else call 02-570-8449 or reach us on LINE @itgenius.
การออกแบบและพัฒนา RESTful web service ในยุคปัจจุบันถือว่าเป็นส่วนที่กำลังได้รับความนิยม และมีความจำเป็นต้องใช้ในการสื่อสารระหว่างเว็บกับแอพพลิเคชั่น การนำเทคโนโลยีของภาษา Java ภายใต้ Spring Framework และ Spring Boot ถือเป็นอีกแนวทางที่น่าสนใจ…
Google Document เป็นบริการออนไลน์ที่สามารถสร้างและจัดการด้านเอกสารได้เพียงแค่เรามี Gmail สำหรับเปิดใช้งานได้ฟรีๆ และมีประสิทธิภาพ โดยชุดเครื่องมือที่มากับ Google Document นั้นประกอบด้วย Google Doc ทำงานด้านการพิมพ์เอกสาร Google Sheet ทำหน้าที่ได้เสมือน…
12 hours2 days
4,000THB
View details
Run this course for your whole team
We run this course in-house, tailored to your stack.