Programming · PRC-31

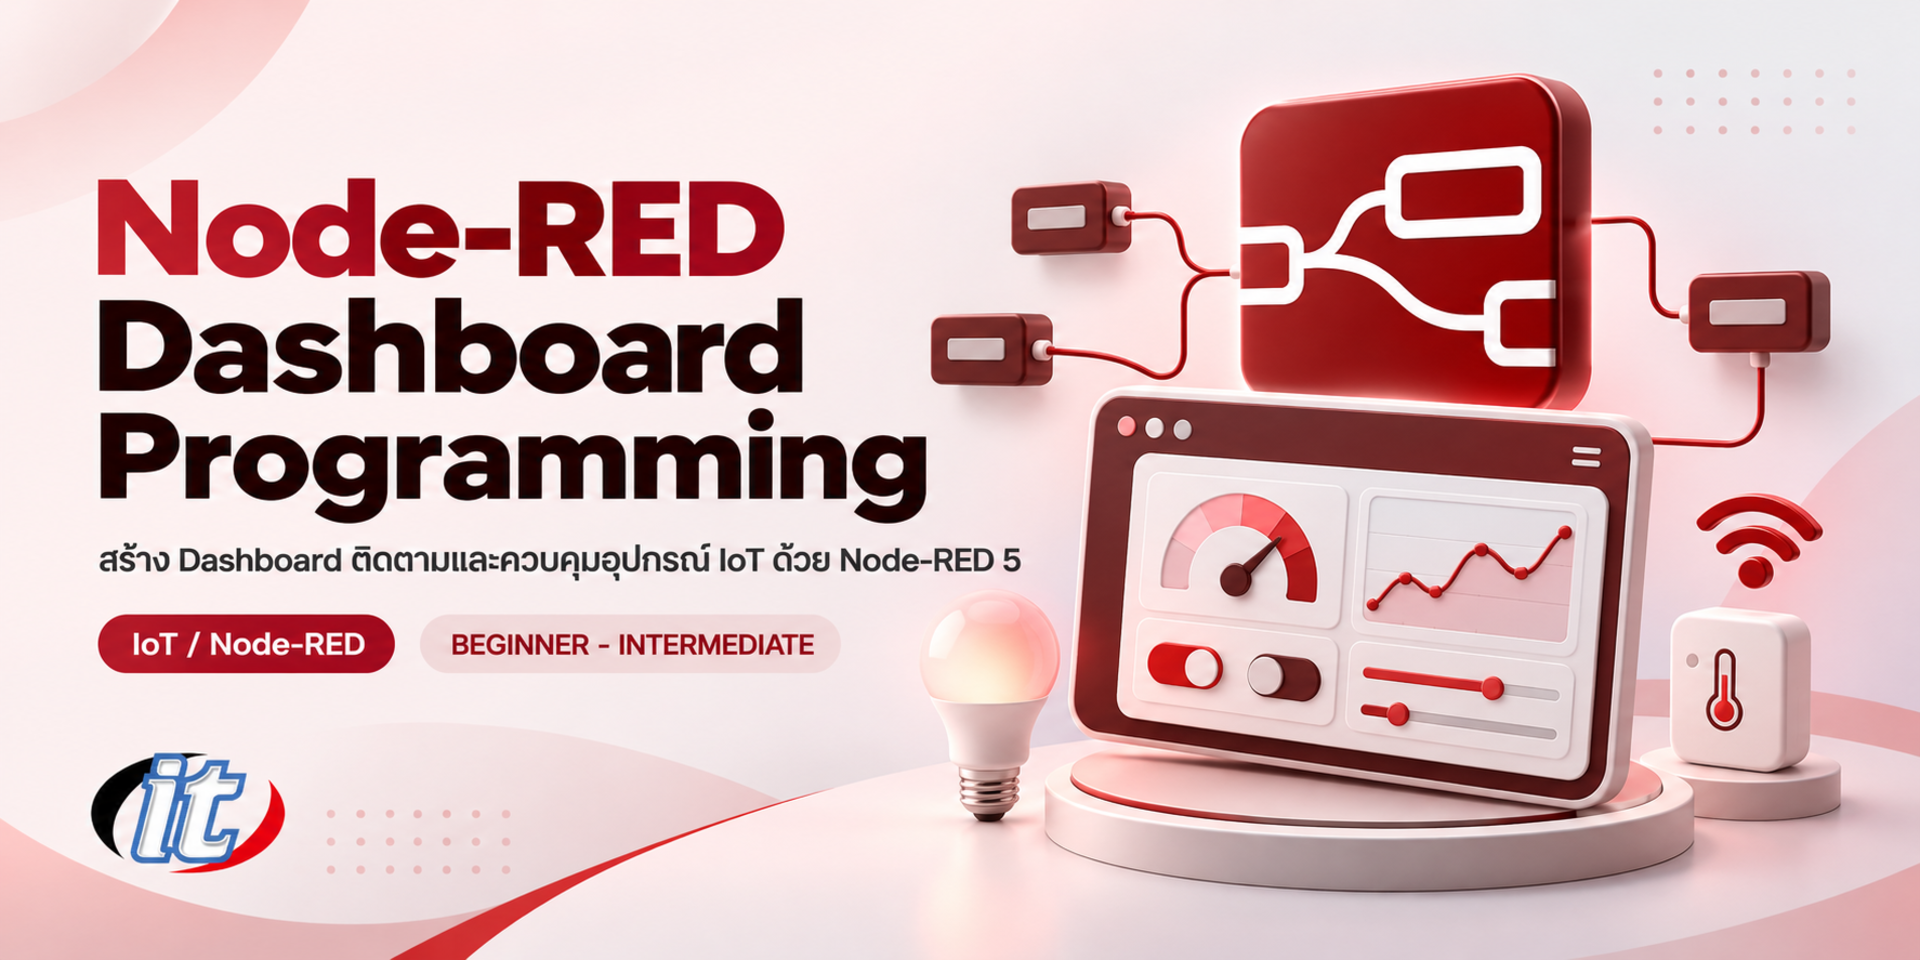
Node-RED Dashboard Programming

Node-RED Dashboard Programming is a hands-on course in flow-based programming with Node-RED, connecting devices through MQTT and APIs, storing data in MySQL and building screens with Dashboard 2.0. It suits system administrators, IoT engineers and anyone with basic programming skills, and you leave able to build a dashboard that monitors and controls IoT devices.

Updated
From 8,550 THB / person 9,500 −10% excl. VAT 7% · group rates available
PDFDownload the course outline
  • Duration18 hours · 3 days
  • FormatOnsite / live online
  • Next round10–12 Nov 26
  • CertificateIncluded

Course overview

Node-RED is a flow-based programming tool in which you wire nodes together in a web browser to connect devices, APIs and services. It is widely used for IoT, factories and automation inside organisations. A dashboard to view data and control devices is essential, yet many examples still use the original node-red-dashboard, built on AngularJS and declared deprecated in 2024, so beginners often get stuck with an approach that should not be used in new projects.

This course takes learners through Node-RED 5 from installation: understanding flows, nodes and the message object, writing Function nodes, using context, building subflows, handling errors, and calling or creating REST APIs. Learners then exchange device data over MQTT and build screens with Dashboard 2.0 (@flowfuse/node-red-dashboard), using both display and control widgets, connect a MySQL database for CRUD and historical charts, customise with ui-template and Vuetify, and secure and deploy everything with Docker. The course closes with an end-to-end IoT monitoring dashboard workshop. (3 days, 6 hours per day, 18 hours in total, Beginner-Intermediate level.)

What you’ll gain

  • Install and use Node-RED 5 with a clear understanding of flows, nodes and the message object
  • Write Function nodes in JavaScript and use context to keep state
  • Build subflows, use environment variables and handle errors in flows
  • Call and create REST APIs with HTTP nodes
  • Exchange device data over MQTT with a Mosquitto broker
  • Build dashboards with Dashboard 2.0, including pages, groups and widgets
  • Connect MySQL for CRUD and show historical data on a dashboard
  • Customise dashboards with ui-template and deploy securely with Docker

Who this course is for

  • System administrators and IT teams who want to build monitoring screens and automation
  • IoT engineers and developers who need dashboards to view data and control devices
  • Users of the original node-red-dashboard who want to move to Dashboard 2.0
  • Students and anyone interested in building dashboard web applications with Node-RED

Prerequisites

  • Basic programming skills; familiarity with JavaScript is helpful
  • Basic networking concepts such as IP addresses, ports and HTTP
  • Basic command-line skills
  • A laptop that can run Node.js and Docker Desktop, with permission to install software

Curriculum

Course Details

This course is the 2026 edition of Node-RED Dashboard Programming. It has been updated for Node-RED 5 on Node.js 24 and moves from the deprecated original node-red-dashboard to Dashboard 2.0 (@flowfuse/node-red-dashboard), with new topics on subflows, error handling, ui-template, security and deployment with Docker. It runs for 3 days, 6 hours per day (18 hours in total, 09:00-16:00), as lectures with labs in every topic. Beginner-Intermediate level. Every lab uses simulated devices and open source tools. Learners take home the flow files for every lab and docker-compose files for Node-RED, Mosquitto and MySQL.

Day 1 Node-RED 5 Fundamentals and Building Flows

Section 1: Lab: Installing and Exploring Node-RED 5

  • What Node-RED and flow-based programming are used for
  • Install Node.js 24 and Node-RED 5 with npm or Docker
  • Tour the Node-RED 5 editor: sidebars, the Explorer and the dark theme
  • settings.js, the user directory and the Palette Manager
  • Export and import flows as JSON files

Section 2: Lab: Flows, Nodes and the Message Object

  • The structure of msg, msg.payload and msg.topic
  • Core nodes: Inject, Debug, Change, Switch, Template and Delay
  • Link nodes, groups and keeping flows readable
  • Lab: a flow that receives values, reformats them and routes them by condition

Section 3: Lab: Function Nodes and Context

  • Write JavaScript in Function nodes and modify msg properties
  • Send to multiple outputs and send several messages
  • Keep state with node, flow and global context
  • Configure a file-based context store so data survives restarts
  • Lab: count readings and compute a moving average of sensor data

Section 4: Lab: Subflows, Environment Variables and Errors

  • Build subflows with properties to reuse logic
  • Use environment variables to keep settings out of flows
  • Handle errors with Catch, Status and Complete nodes
  • Lab: a subflow that validates and converts device data for any flow

Section 5: Lab: HTTP Nodes and RESTful APIs

  • Call external APIs with the HTTP Request node and parse JSON
  • Create HTTP endpoints with HTTP In and HTTP Response
  • Design a RESTful API for receiving data from devices
  • Lab: an API that receives sensor values and an API that fetches weather data

Day 2 MQTT and Dashboard 2.0

Section 6: Lab: MQTT with Mosquitto

  • How MQTT works: brokers, topics, wildcards, QoS and retained messages
  • Install Mosquitto locally or with Docker, with a username and password
  • Send and receive JSON data with the MQTT In and MQTT Out nodes
  • Lab: several simulated devices publish to the broker and Node-RED processes the data

Section 7: Lab: Getting Started with Dashboard 2.0

  • Why the original node-red-dashboard was retired and what changes in Dashboard 2.0
  • Install @flowfuse/node-red-dashboard through the Palette Manager
  • The structure of ui-base, ui-page, ui-group and ui-theme
  • Choose a layout for each page and support mobile screens
  • Open the dashboard at /dashboard and set up multi-page navigation

Section 8: Lab: Display Widgets

  • ui-chart line and bar charts for real-time data
  • ui-gauge and ui-text for current values
  • ui-table for lists of records and ui-notification for alerts
  • Lab: a page showing temperature, humidity and device status

Section 9: Lab: Input and Control Widgets

  • ui-button, ui-switch and ui-slider for sending commands
  • ui-dropdown, ui-text-input and ui-form for collecting input
  • Send commands from the dashboard to devices over MQTT
  • Keep state in sync between several users on the same page
  • Lab: a control panel to switch devices and set alert thresholds

Section 10: Workshop: A Real-Time Device Monitoring Dashboard

  • Design dashboard pages for operators and administrators
  • Combine MQTT and API data on a single page
  • Raise dashboard alerts when values cross a threshold
  • Test on desktop and mobile screens
Day 3 Databases, Customisation and Deployment

Section 11: Lab: Connecting a MySQL Database

  • Run MySQL or MariaDB with Docker and design tables for device data
  • Use node-red-node-mysql to send queries through msg.topic
  • CRUD with parameters instead of string concatenation to prevent SQL injection
  • Lab: save MQTT data to the database automatically

Section 12: Lab: Historical Data and Reports on the Dashboard

  • Query data by time range and summarise it by hour or day
  • Show historical charts with ui-chart and pick the time range on the dashboard
  • Add and edit records with ui-form and ui-table
  • Lab: a report page with CSV download

Section 13: Lab: Customising with ui-template and Themes

  • Build your own widgets in ui-template with Vue and Vuetify components
  • CSS for all pages or a single page, and ui-theme settings
  • Control page navigation and visibility with ui-control
  • Lab: a custom device status card

Section 14: Security and Deployment

  • Protect the editor with adminAuth and enable HTTPS
  • Separate data per user with client constraints in Dashboard 2.0
  • Deploy Node-RED, Mosquitto and MySQL with Docker Compose
  • Back up flows and manage versions with Projects and Git

Section 15: Workshop: An End-to-End IoT Monitoring Dashboard

  • Simulated devices send data over MQTT into Node-RED
  • Store it in MySQL and show both live values and historical charts
  • Raise alerts and control devices from the dashboard
  • Present the work and discuss how to extend it in your organisation

Schedule & training options

For individuals — public rounds

10–12November
Classroom10–12 Nov 26
20 seats left
12–14January
Classroom12–14 Jan 27
20 seats left
9–11March
Classroom9–11 Mar 27
20 seats left
25–27May
Classroom25–27 May 27
20 seats left
6–8July
Classroom6–8 Jul 27
20 seats left
7–9September
Classroom7–9 Sep 27
20 seats left
16–18November
Classroom16–18 Nov 27
20 seats left

For organisations — in-house / private

  • Tailor the content to your team’s tools and projects
  • Your dates, at your office or live online
  • Quotation with tax ID for procurement
Corporate training quote

Instructors

Frequently asked questions

What is Node-RED and what can it be used for?

Node-RED is a flow-based programming tool built on Node.js. You create programs by dragging nodes onto an editor in your web browser and wiring them together, and data flows between nodes as a message object whose main data is msg.payload. It is widely used to connect IoT devices and sensors, call or create APIs, save data to databases and build real-time dashboards, and you can add JavaScript in a Function node when needed. The current release is Node-RED 5, which requires Node.js 22.9 or later.

What is MQTT and how is it used with Node-RED?

MQTT is a lightweight publish/subscribe messaging protocol that is popular in IoT. Devices publish messages to a topic through an intermediary called a broker, such as Mosquitto, and anyone subscribed to that topic receives them immediately. In Node-RED, the mqtt in node receives messages from a topic and the mqtt out node sends them. You configure the broker address and credentials in the node, then wire it to other nodes, such as a Function node or a dashboard widget, to process and display the data.

Should I use Dashboard 2.0 or the original node-red-dashboard?

New projects should use Dashboard 2.0, installed from the @flowfuse/node-red-dashboard package through Manage palette. The original node-red-dashboard is built on AngularJS, which is no longer maintained, and its maintainers declared it deprecated in 2024. Dashboard 2.0 is built on Vue, organises screens into pages and groups, offers a full set of display and input widgets and can be extended with ui-template. Existing systems on the old version should plan to migrate their flows page by page.

Who is the Node-RED Dashboard Programming course for, and what should I know beforehand?

It suits system administrators and IT teams who want monitoring screens, IoT engineers and developers, users of the old dashboard who want to move to Dashboard 2.0, and students interested in building dashboard web applications. You should have basic programming skills, ideally some JavaScript, basic networking knowledge and basic command-line skills.

What will I be able to do after the Node-RED Dashboard Programming course?

You will be able to install and use Node-RED 5, write flows, Function nodes and subflows, call and create REST APIs, exchange device data over MQTT, build Dashboard 2.0 screens with display and control widgets, connect MySQL for CRUD and historical charts, customise with ui-template and deploy securely with Docker. Participants who complete the training receive a Certificate of Completion with its own number, which can be verified online.

What software do I need to prepare for the Node-RED Dashboard Programming course?

Bring a Windows, macOS or Linux laptop with permission to install software, able to run Node.js 24 LTS and Docker Desktop. Node-RED 5, Dashboard 2.0, Mosquitto and MySQL are installed together in class. Every lab uses simulated devices, so no hardware is needed, though you are welcome to connect your own IoT board.

Related articles

Articles are published in Thai.